Example of 5th Grade STEM Fair Project
|
Here is an example of a STEM Fair @ Root project that was completed by two 5th graders, Zoe Durland and Emma Lyon.
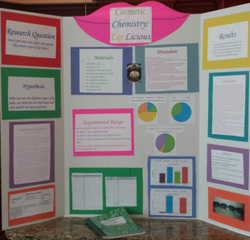
Their display at the STEM Fair included samples of the lip gloss as well as the poster and scientific journal you see here. Some of the project guidelines have changed since then, but many things are the same. Let's take a look at how these two Root students used the scientific method to answer an interesting question with an experiment. |

Project by Zoe Durland and Emma Lyon, Spring 2013
|
This poster has:
- Title - Research Question - Hypothesis - Background Information - List of Variables - Materials - Procedure - Experimental Design (not required but helpful) - Results presented in tables, graphs, and words - Conclusions - Sources |
Challenge: Print a copy of the Self Checklist and the Reviewer Form.
As we describe each section of this STEM Fair project, see how you would rate it.
As we describe each section of this STEM Fair project, see how you would rate it.
Title
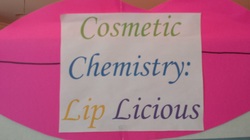
The poster has a creative title that attracts attention. It is related to the project. If the students wanted a higher review score, they could choose a title that tells more about the actual project, like, "What Makes Lip Gloss Lip-Licking Good: Color or Flavor?". New in 2013-2014: You can get a bonus point if your final poster title matches the title on your confirmation form...so plan ahead when you submit your confirmation form!
The poster has a creative title that attracts attention. It is related to the project. If the students wanted a higher review score, they could choose a title that tells more about the actual project, like, "What Makes Lip Gloss Lip-Licking Good: Color or Flavor?". New in 2013-2014: You can get a bonus point if your final poster title matches the title on your confirmation form...so plan ahead when you submit your confirmation form!
Authors
This was not required in previous years. In 2013-2014, be sure to list your name (and your partner's name if you worked as a team). It can look like this:
By Zoe Durland and Emma Lyon
This was not required in previous years. In 2013-2014, be sure to list your name (and your partner's name if you worked as a team). It can look like this:
By Zoe Durland and Emma Lyon
Research Question
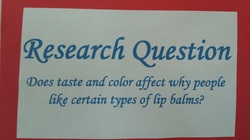
This is the question these authors wanted to answer. It is an interesting question, and can be answered with an experiment.
This is the question these authors wanted to answer. It is an interesting question, and can be answered with an experiment.
Background Information
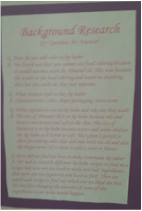
The authors read a lot to learn more about how to do their experiment, and why certain ingredients are used. Sometimes you have to read before you can state your hypothesis. You may even find it helpful to read before you write your final research question. Your scientific journal is a great place to keep track of this information while you are thinking about it.
Remember to write down where you learned the facts. These authors did a good job of listing their references and acknowledging people who helped them (see "Sources").
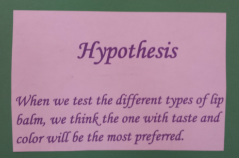
Hypothesis
The authors made a prediction, their scientific best guess about what they expected to find at the end of the experiment. Remember, it does not matter if your prediction matches the results--as long as you make a reasonable prediction and test it with an experiment. Keep reading the poster to see if this hypothesis was supported by the experiment results...
The authors made a prediction, their scientific best guess about what they expected to find at the end of the experiment. Remember, it does not matter if your prediction matches the results--as long as you make a reasonable prediction and test it with an experiment. Keep reading the poster to see if this hypothesis was supported by the experiment results...
|
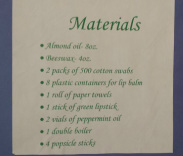
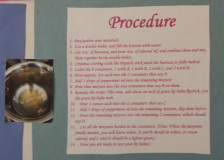
Methods
This can be one section, or it can be divided into separate"Materials" and "Procedures" sections like these authors did. Either way is fine. Notice how specific they were--that is the way to do this! Their photograph helps us understand how the mixture looked. It could be improved with a caption explaining the picture. |
|
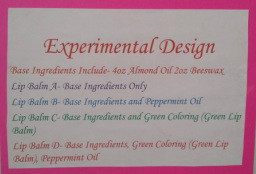
Design
The authors described each of their conditions. Because they had two independent variables (see below), they needed four conditions to test their hypothesis that color and flavor both affect popularity of lip balm. If they had used only one independent variable, they would only need two conditions. For example, if they chose to test whether color mattered, they would have a "no color" control group, and a "with color" experimental group. In this case, they could have used the word "control" to describe lip balm A, and "experimental" to describe the other lip balms.
The authors described each of their conditions. Because they had two independent variables (see below), they needed four conditions to test their hypothesis that color and flavor both affect popularity of lip balm. If they had used only one independent variable, they would only need two conditions. For example, if they chose to test whether color mattered, they would have a "no color" control group, and a "with color" experimental group. In this case, they could have used the word "control" to describe lip balm A, and "experimental" to describe the other lip balms.
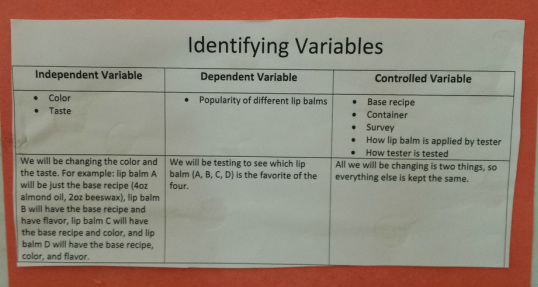
Variables
The variables can be part of the Design section or they can be a separate section. See how the authors listed exactly what they planned to change (the independent variables), what they planned to measure (the dependent variable), and what they planned to control--to keep the same in every situation (the controlled variables). This table makes it very easy for us to see their variables.
By the way, for the STEM Fair @ Root, you only need to have one independent variable. In this project, they could have chosen just color to compare (comparing clear lip balm with one color of lip balm). They could have chosen just flavor to compare (comparing plain lip balm with flavored lip balm).
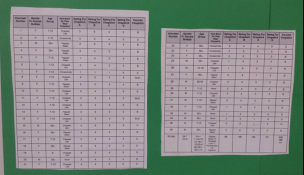
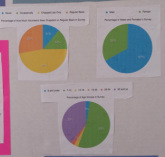
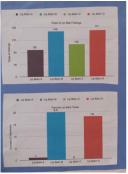
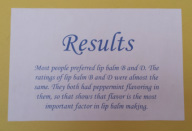
Results
These authors really went above and beyond when they presented their data in the Results section! They used tables, graphs, and words. When you look at your results in all these ways, it can help you see patterns that are important to talk about in the Conclusions section. Notice that the authors labelled each column in the tables so we can tell what the numbers mean. Each of their pie graphs has a title and a key explaining what each color represents. The bar graphs also have titles and keys. It can be hard to know what words to put in the Results section and which to save for the Conclusions section. Usually scientists describe the pattern in the Results section (like the first two sentences the authors used), and save their interpretation of what it means for the Conclusions section. The tables and graphs are really great examples of what to do in your Results section!
These authors really went above and beyond when they presented their data in the Results section! They used tables, graphs, and words. When you look at your results in all these ways, it can help you see patterns that are important to talk about in the Conclusions section. Notice that the authors labelled each column in the tables so we can tell what the numbers mean. Each of their pie graphs has a title and a key explaining what each color represents. The bar graphs also have titles and keys. It can be hard to know what words to put in the Results section and which to save for the Conclusions section. Usually scientists describe the pattern in the Results section (like the first two sentences the authors used), and save their interpretation of what it means for the Conclusions section. The tables and graphs are really great examples of what to do in your Results section!
|
|
|
|
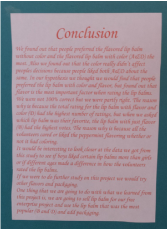
Conclusions
The authors summarized the results and what they mean (that flavor matters more than color when it comes to popularity of lip balm). They compared their findings with the original hypothesis, and talked about how they matched and how they were different. They described how their results supported their conclusions.
Future Directions
In previous years, this was not required. In 2013-2014, we are asking Root students to add this section. It can be part of the Conclusions section or it can be a separate section. These authors wrote about what they would do differently next time. They applied the results from this STEM Fair @ Root project to a real-life situation, marketing and selling lip balm.
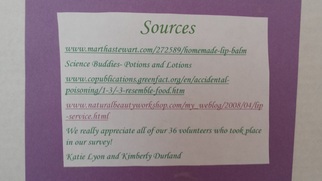
References, Acknowledgements
This was not required in previous years; these authors went above and beyond to include this information! Starting in 2013-2014, we recommend that each project have two separate sections on the poster for this information:
- References: List websites, books, magazine/newspaper articles you read. Ideally you will read at least one book or book chapter as part of your project.
- Acknowledgements: List people who helped you, such as parents, teachers, and participants. If someone donates materials, this is a good place to say thank you. Include a description of how each person helped, like, "We would like to acknowledge our parents, who helped us cook the lip balm and did not complain about the sticky mess we made."
Overall
The authors turned their poster and scientific journal in on time. This STEM project is an experiment--the authors compared two things, keeping everything else constant. They asked a testable question and stated a hypothesis. They created a rating scale so they could measure how much each person liked each lip gloss. These students asked teachers and parents for help getting to the library, getting materials, heating materials, and printing their project, but they did the thinking and writing by themselves. They made a poster (which was easy to do because they had good notes in their scientific journal). They gave a short presentation to the visiting STEM professionals, and answered their questions about the project. The pictures helped us see what they did. The poster is neat and tidy, and is well-organized. It is interesting to see, and the different colored paper around each section make it easy to recognize each section. Overall, this STEM Fair @ Root project is fantastic!
The authors turned their poster and scientific journal in on time. This STEM project is an experiment--the authors compared two things, keeping everything else constant. They asked a testable question and stated a hypothesis. They created a rating scale so they could measure how much each person liked each lip gloss. These students asked teachers and parents for help getting to the library, getting materials, heating materials, and printing their project, but they did the thinking and writing by themselves. They made a poster (which was easy to do because they had good notes in their scientific journal). They gave a short presentation to the visiting STEM professionals, and answered their questions about the project. The pictures helped us see what they did. The poster is neat and tidy, and is well-organized. It is interesting to see, and the different colored paper around each section make it easy to recognize each section. Overall, this STEM Fair @ Root project is fantastic!